AP Statistics is equivalent to the first-semester course of introduction to statistics at many universities. The AP Statistics exam content includes data exploration, sampling and experimentation, prediction models, and statistical inference. In this guide, we will explain what is on the exam, show you sample problems, and important tips and tricks to get a great score on the exam.
1. What’s the format of the AP Statistics exam?
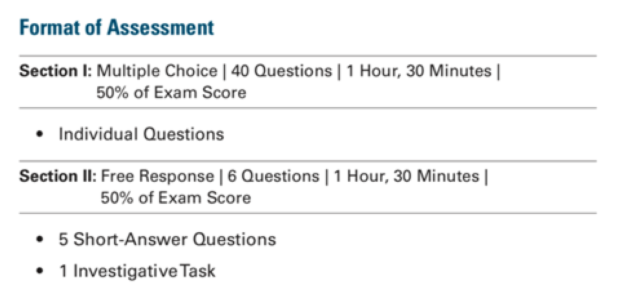
Due to the pandemic, there are several adjustments and differences between the paper and digital AP Statistics exams. Overall, the digital exam will include more multiple-choice questions and fewer free-response questions. However, the length of the exam will stay the same. The test is 3 hours long and contains two sections as does the paper exam: multiple choice and free response. Students are allowed to bring a graphing calculator.
2. What’s covered in the AP Statistics exam?
The AP Course and Exam cover around 9 units with specific topics students should focus on. The College Board also provides the percentage of score that each unit will contribute in the exam.
Unit 1: Exploring One-Variable Data (15-23% of exam)
- Variation in categorical and quantitative variables
- Representing data using tables or graphs
- Calculating and interpreting statistics
- Describing and comparing distributions of data
- The normal distribution
Unit 2: Exploring Two-Variable Data (5-7% of exam)
- Comparing representations of 2 categorical variables
- Calculating statistics for 2 categorical variables
- Representing bivariate quantitative data using scatter plots
- Describing associations in bivariate data and interpreting correlation
- Linear regression models
- Residuals and residual plots
- Departures from linearity
Unit 3: Collecting Data (12-15% of exam)
- Planning a study
- Sampling methods
- Sources of bias in sampling methods
- Designing an experiment
- Interpreting the results of an experiment
Unit 4: Probability, Random Variables, and Probability Distributions (10-20% of exam)
- Using simulation to estimate probabilities
- Calculating the probability of a random event
- Random variables and probability distributions
- The binomial distribution
- The geometric distribution
Unit 5: Sampling Distributions (7-12% of exam)
- Variation in statistics for samples collected from the same population
- The central limit theorem
- Biased and unbiased point estimates
- Sampling distributions for sample proportions
- Sampling distributions for sample means
Unit 6: Inference for Categorical Data: Proportions (12-15% of exam)
- Constructing and interpreting a confidence interval for a population proportion
- Setting up and carrying out a test for a population proportion
- Interpreting a p-value and justifying a claim about a population proportion
- Type I and Type II errors in significance testing
- Confidence intervals and tests for the difference of 2 proportions
Unit 7: Inference for Quantitative Data: Means (10-18% of exam)
- Constructing and interpreting a confidence interval for a population mean
- Setting up and carrying out a test for a population mean
- Interpreting a p-value and justifying a claim about a population mean
- Confidence intervals and tests for the difference of 2 population means
Unit 8: Inference for Categorical Data: Chi-Square (2-5% of exam)
- The chi-square test for goodness of fit
- The chi-square test for homogeneity
- The chi-square test for independence
- Selecting an appropriate inference procedure for categorical data
Unit 9: Inference for Quantitative Data: Slopes (2-5% of exam)
- Confidence intervals for the slope of a regression model
- Setting up and carrying out a test for the slope of a regression model
- Selecting an appropriate inference procedure
3. When is the AP Statistics exam time
The AP Statistics will be held in May in person, on Thursday, May 8, 2025
4. Calculator use
A graphing calculator is allowed on the exam, but the calculator has to be on the approved list.
The following is a list of calculator models that can be used for the AP Statistics exam:

The multiple-choice questions are graded very straightforward, with each one question right earns you one point. For the free-response questions, each question will give you 0 to 4 points, depending on how well you answer it
4 – Complete Response – Three parts essentially correct
3 – Substantial Response – Two parts essentially correct and one part partially correct
2 – Developing Response – Two parts essentially correct and no parts partially correct OR One part essentially correct and one or two parts partially correct OR Three parts partially correct
1 – Minimal Response – One part essentially correct OR No parts essentially correct and two parts partially correct
0 – No Response: – Didn’t answer any questions correctly or did not have an answer
5. AP Statistics Exam Score Information
The 5-point and 4-point rates of the AP Statistics exam are very important in understanding the probability of getting a high score. The 5-point rate reflects the test difficulty and scoring criteria of the subject to a certain extent.
The following is the latest score distribution data of AP Statistics in 2021 for your reference.
Subject | 5 points | 4 points | 3 points | 2 point | 1 point |
AP Statistics | 14.8% | 22.2% | 23.4% | 16.5% | 23.1% |
6. Tips to nail the course and the AP Statistics Exam
#1 Study and review the material thoroughly
AP Statistics covers a lot of information that you should know in length and depth.
The first big idea you should remember is data exploration, which includes graphical analysis and numerical techniques. Key topics include variability, location, standard deviation, and unusual values in data to get conjectures, association, causation, etc. Students also learn to compare different data sets to discover patterns and draw conclusions.
The next big idea is sampling and experiments, with the focus on data collection. Topics include multiple data collection methods, data analysis methods, and their application.
The third big idea is anticipating patterns, which relies primarily on the study of probability and data distribution. Students will study variation in data patterns and probability distribution.
The final big idea is statistical inference, which discusses appropriate statistical models. Students learn how to estimate population parameters and test hypotheses. Important topics include margins of error, confidence intervals, p-value, test of significance, and so on.
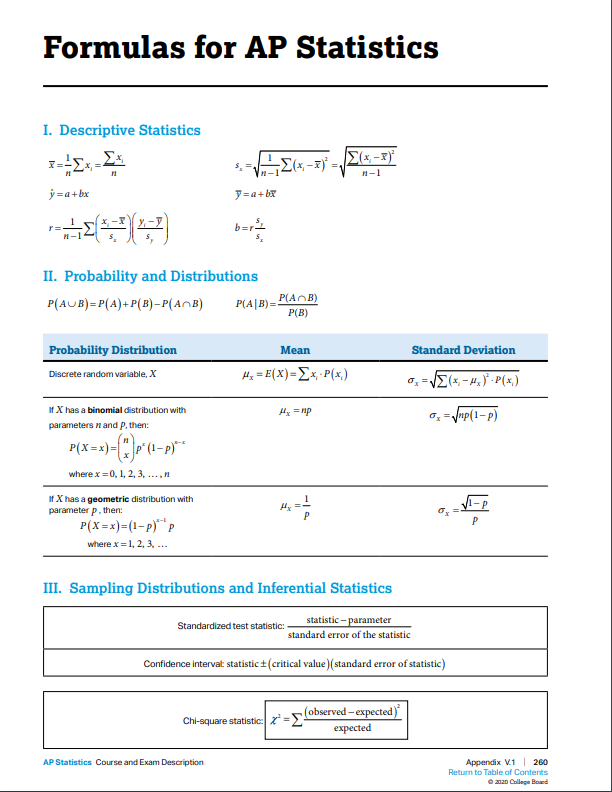
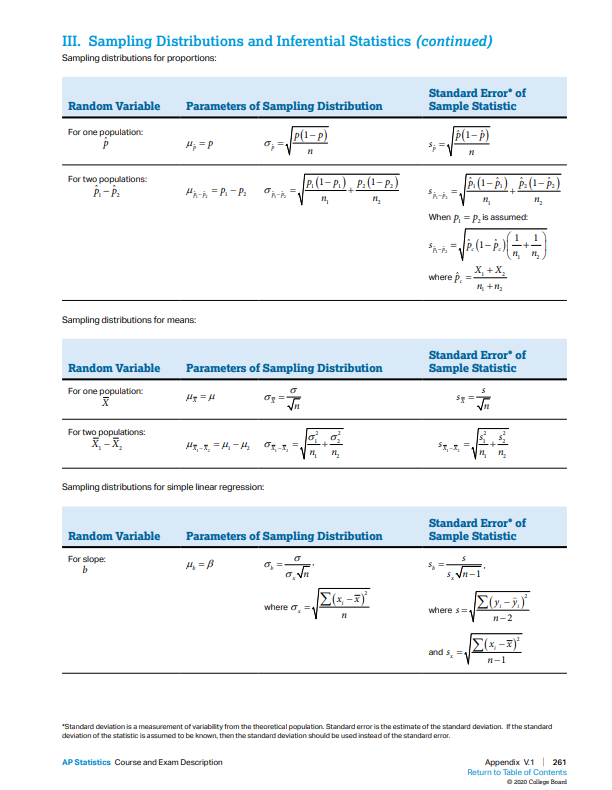
Besides those big ideas, you should also memorize and be familiar with the formulas used on the AP Statistics exam. The formulas can be found on page 260 of AP Statistics Course Guide.
#2 Practice, Practice, practice
For the multiple-choice questions, you can take practice tests on College Board (page 240) or other websites online like Stat Trek. As you go through all the questions, remember to keep track of the questions you got wrong, and review them again. For the free-response questions, College Board released the past free-response questions from the 1998 to 2018 exams for you to gain further practice.
As of April 8, 2021, you can also try out the Digital Practice Exam to be more familiar with the software and format of the exam.
#3 Plan your study strategically
Below is an example of a to-do list provided by the Senior VP of Advanced Placement at the College Board. We recommend that you set up a strategic study plan depending on how much time you have left until the AP test. With proper planning, you won’t overload yourself with the AP Statistics coursework and gain enough practice before the actual exam.

Introducing Aralia Test Preparation Bootcamp, where students can excel in standardized tests with our comprehensive approach. At Aralia, we prioritize maximizing study efficiency and accelerating score improvement through a combination of practice examinations, expert strategies, and personalized guidance. Our Bootcamp offers students the opportunity to achieve significant score improvements within a condensed timeframe by learning strategic approaches tailored to their individual needs. With instructors who are AP readers, students benefit from expert teaching and gain valuable insights into exam techniques. Furthermore, our program equips students with versatile skills and strategies that can be applied to a range of standardized tests, ensuring they are well-prepared to adapt to various exam types.
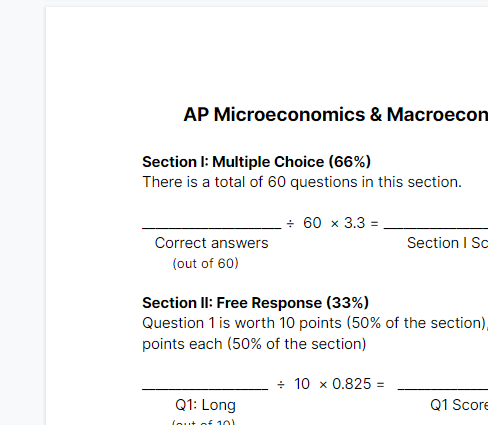
With the scoring worksheet, you will be able to calculate your target score in preparation for the upcoming exam in May. We also have a full scoring worksheet available below if you want to print it out and keep it in your folder.


